How big is your circle, and is it actually growing?
The most basic social life statistic is also the easiest to lose track of: how many people are actually in your circle, and whether that number is holding steady, growing, or quietly stalling. A running count that's been flat for six months is a different situation than one that's still climbing, even if both look the same from memory. Growth is worth tracking as its own number too, not just the total, since a circle can stay the same size while quietly turning over, or add ten new acquaintances while your actual core group of friends doesn't change at all. In BuddyLog this shows up as Total Buddies (an all-time count, plus how many you added this year and your single best month) and New People Met, which only counts someone once you've recorded when you first met them, so it reflects deliberate logging rather than just names you happened to add.
Who you actually see, versus who's slipping away
Circle size tells you almost nothing about whether you're actually in touch with the people in it. Two more specific statistics matter more day to day: who you've spent the most time with recently, and how much of your whole circle you've actually seen at all in a given stretch. That second one is easy to get wrong from memory, since it's entirely possible to feel busy and social while actually only seeing the same three people on repeat, leaving most of your circle untouched for months. The mirror image of both is arguably more useful than either: a running list of exactly who you haven't seen in the longest time, sorted oldest gap first. Memory is bad at tracking gaps that grow gradually; a month feels the same as it always does right up until it's been half a year. BuddyLog calculates these as Most Seen, Social Reach (shown as a fraction like 17 of 25 buddies), and Long Time No See.
How often, and how, you actually socialize
Beyond who, there's a whole layer of statistics about how you spend time with people. How often you're actually getting together, not how often it feels like you are. What you actually do together most, whether that's dinner, coffee, or something more occasional like a trip. Which day of the week and time of day your social life tends to cluster around, which is often a small surprise, since assumptions like "we always hang out on weekends" rarely survive an actual look at logged dates. And whether your get-togethers lean one-on-one or toward bigger groups. None of these are stats you'd naturally track in your head, since they require pattern-matching across months of interactions, exactly the kind of thing a log does well and memory does poorly. BuddyLog calculates these as Events Logged (with an average frequency, like "one every 2 days"), Top Activity, Top Day, Peak Time, and Group Size.
What consistency looks like over a year
One statistic is more useful as a picture than as a number: a 12-month calendar with a mark on every day you actually met up with someone. Numbers can hide a lot; a healthy-looking monthly average can be built from one busy week followed by silence. A calendar doesn't hide that the same way. A quiet March sitting next to a packed December is obvious at a glance, in a way no summary number captures. BuddyLog calls this Meeting Frequency, and it's worth checking even if you skip every other stat here.
What one relationship looks like up close
Every statistic above can also be scoped down to a single person instead of your whole circle: how often you've seen them, what you do together, which day and time, typical group size. That reframing turns a general habit-tracking tool into something closer to a relationship-specific one, and it adds one more statistic that doesn't quite make sense at the circle level: actual hours spent with that one person, added up over a year. Getting that number right needs a specific rule, since a weekend trip and a quick coffee don't stack the same way. The most accurate approach counts a timed event's actual duration (dinner, coffee), counts a full 24 hours for each day of an all-day event (a trip, a visit), and if a timed event falls on the same day as an all-day one, only counts the all-day event, so a dinner during a 3-day vacation isn't added on top of the 72 hours that vacation already represents. BuddyLog calls this Time Together.
Example: a 3-day vacation with a friend counts as 3 × 24h = 72 hours. Dinner on day 2 of that same vacation isn't counted separately. Coffee with them on an unrelated day (1.5h) is counted on top.
Who's actually in your circle
One more useful cut of the same data has nothing to do with activity: a straightforward breakdown of who's in your circle by gender and by age range. It's less about socializing patterns and more a sanity check on whether your circle is as varied as you assume, or has quietly narrowed to people who look a lot like you. BuddyLog calls these Gender Split and Age Groups, and only counts people with the relevant detail recorded, so anyone missing a birth year, for instance, falls into its own "unknown" group rather than skewing the chart.
Do you need an app to track any of this?
Not strictly. Everything above can be tracked by hand; a running list of names and dates in a notebook or spreadsheet gets you most of the way there. What's actually hard is doing it consistently for long enough that the patterns become visible, which is the same reason most people's mental model of their own social life stays vague no matter how much they'd like it to be otherwise. That's the real case for an app built around this specifically. BuddyLog logs a get-together in about fifteen seconds and calculates every statistic above automatically from what you've logged, as part of BuddyLog Premium. Adding people and logging events themselves stay free with no limit either way.
FAQ
What social life statistics are worth tracking?
The useful ones fall into a few groups: how big your circle is and whether it's growing, who you actually see versus who's slipping away, how often and in what way you socialize, and what one specific relationship looks like up close. A breakdown of who's in your circle demographically is worth a look too.
What's the difference between social reach and seeing one friend the most?
One stat tells you who you spent the most time with in a period. Social reach is broader: what share of your entire circle you actually saw at all, shown as a fraction like 17 of 25.
Do you need an app to track these statistics?
No, most can be tracked manually. It's just tedious to do consistently, which is why apps built for this, like BuddyLog, calculate it automatically from events you log in seconds.
How do you calculate time spent with one person?
Add up actual duration for timed get-togethers; count a full 24 hours per day for all-day events. If a timed event falls on the same day as an all-day one, only the all-day event counts, so nothing gets double-counted.
At a glance
Here's what all of these actually look like once calculated, pulled straight from BuddyLog's Insights tab. Most recalculate over a period you choose, Week, Month, 6 Months, or Year, so the same stat can look different depending on the window.

1. Total Buddies
All-time count added, plus this year and your peak month.

2. New People Met
First encounters logged this period.

3. Most Seen
Person you spent the most logged time with this period.

4. Social Reach
Share of your whole circle you've actually seen this period.

5. Long Time No See
People you haven't seen in the longest time.

6. Events Logged
All-time count, plus your average logging frequency.

7. Top Activity
Most common type of get-together this period.

8. Top Day
Day of week with the most logged get-togethers.

9. Group Size
Most common number of people per get-together.

10. Peak Time
Time of day you socialize most.

11. Meeting Frequency
12-month calendar heatmap of meetup days.

12. Time Together
Hours spent with one person this year.
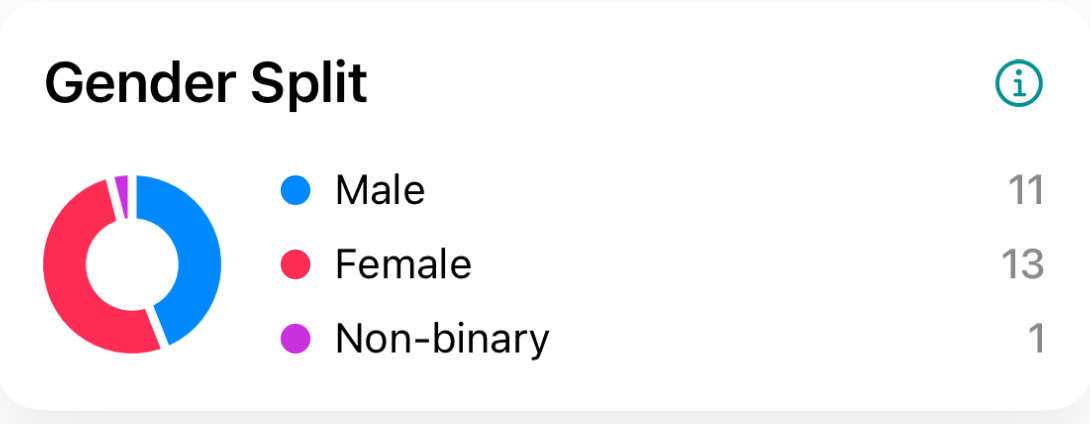
13. Gender Split
Your circle by recorded gender.
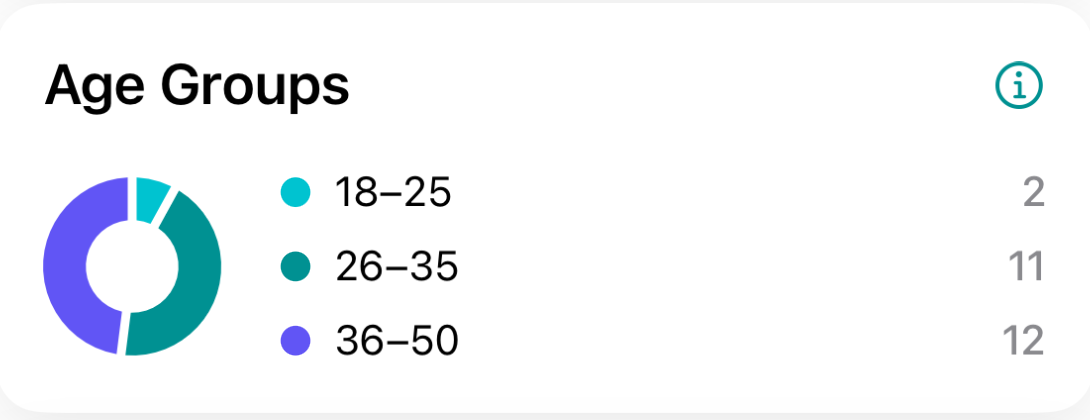
14. Age Groups
Your circle by age range.
Where BuddyLog fits
None of these statistics exist without a logging habit underneath them, which is really the harder problem to solve. If you're weighing whether that kind of habit is worth building at all, the full guide to keeping a friendship journal is the better place to start than this list. And if Long Time No See is the one that caught your eye, here's the story of why I built it in the first place, sorting friends by who's overdue to see rather than just logging them.